ESP RainMaker Customer Docs

ESP RainMaker Customer Docs

  • Get Started
  • Releases
  • Help

›Monitoring

Introduction

  • Introduction

RainMaker Cloud

  • RainMaker Cloud
  • Prerequisites
  • Pre-Deployment Setup
  • Setup
  • Backend
  • Node Registration Module
  • Frontend
  • Post-Deployment Setup
  • Verification
  • Licensing
  • Deployment settings
  • Add-on services
  • Push Notifications
  • Upgrades
  • Configurations
  • Uninstall

Phone Apps

  • Android Configuration
  • iOS Configuration
  • Notification payloads

CLIs

  • CLI

Firmware

  • Firmware

3rd Party Logins

  • Sign-in with Google
  • Sign-in with Apple

Integrations

  • Voice Assistant Integrations
  • Alexa
  • Google Assistant
  • Voice Assistant Integrations AddOns repo
  • Alexa Account Linking
  • Publishing Alexa skill
  • Publishing GVA action
  • Upgrades

Features

  • Features

Monitoring

  • RainMaker Monitoring Dashboard

References

  • References

RainMaker Monitoring Dashboard

[中文版本]

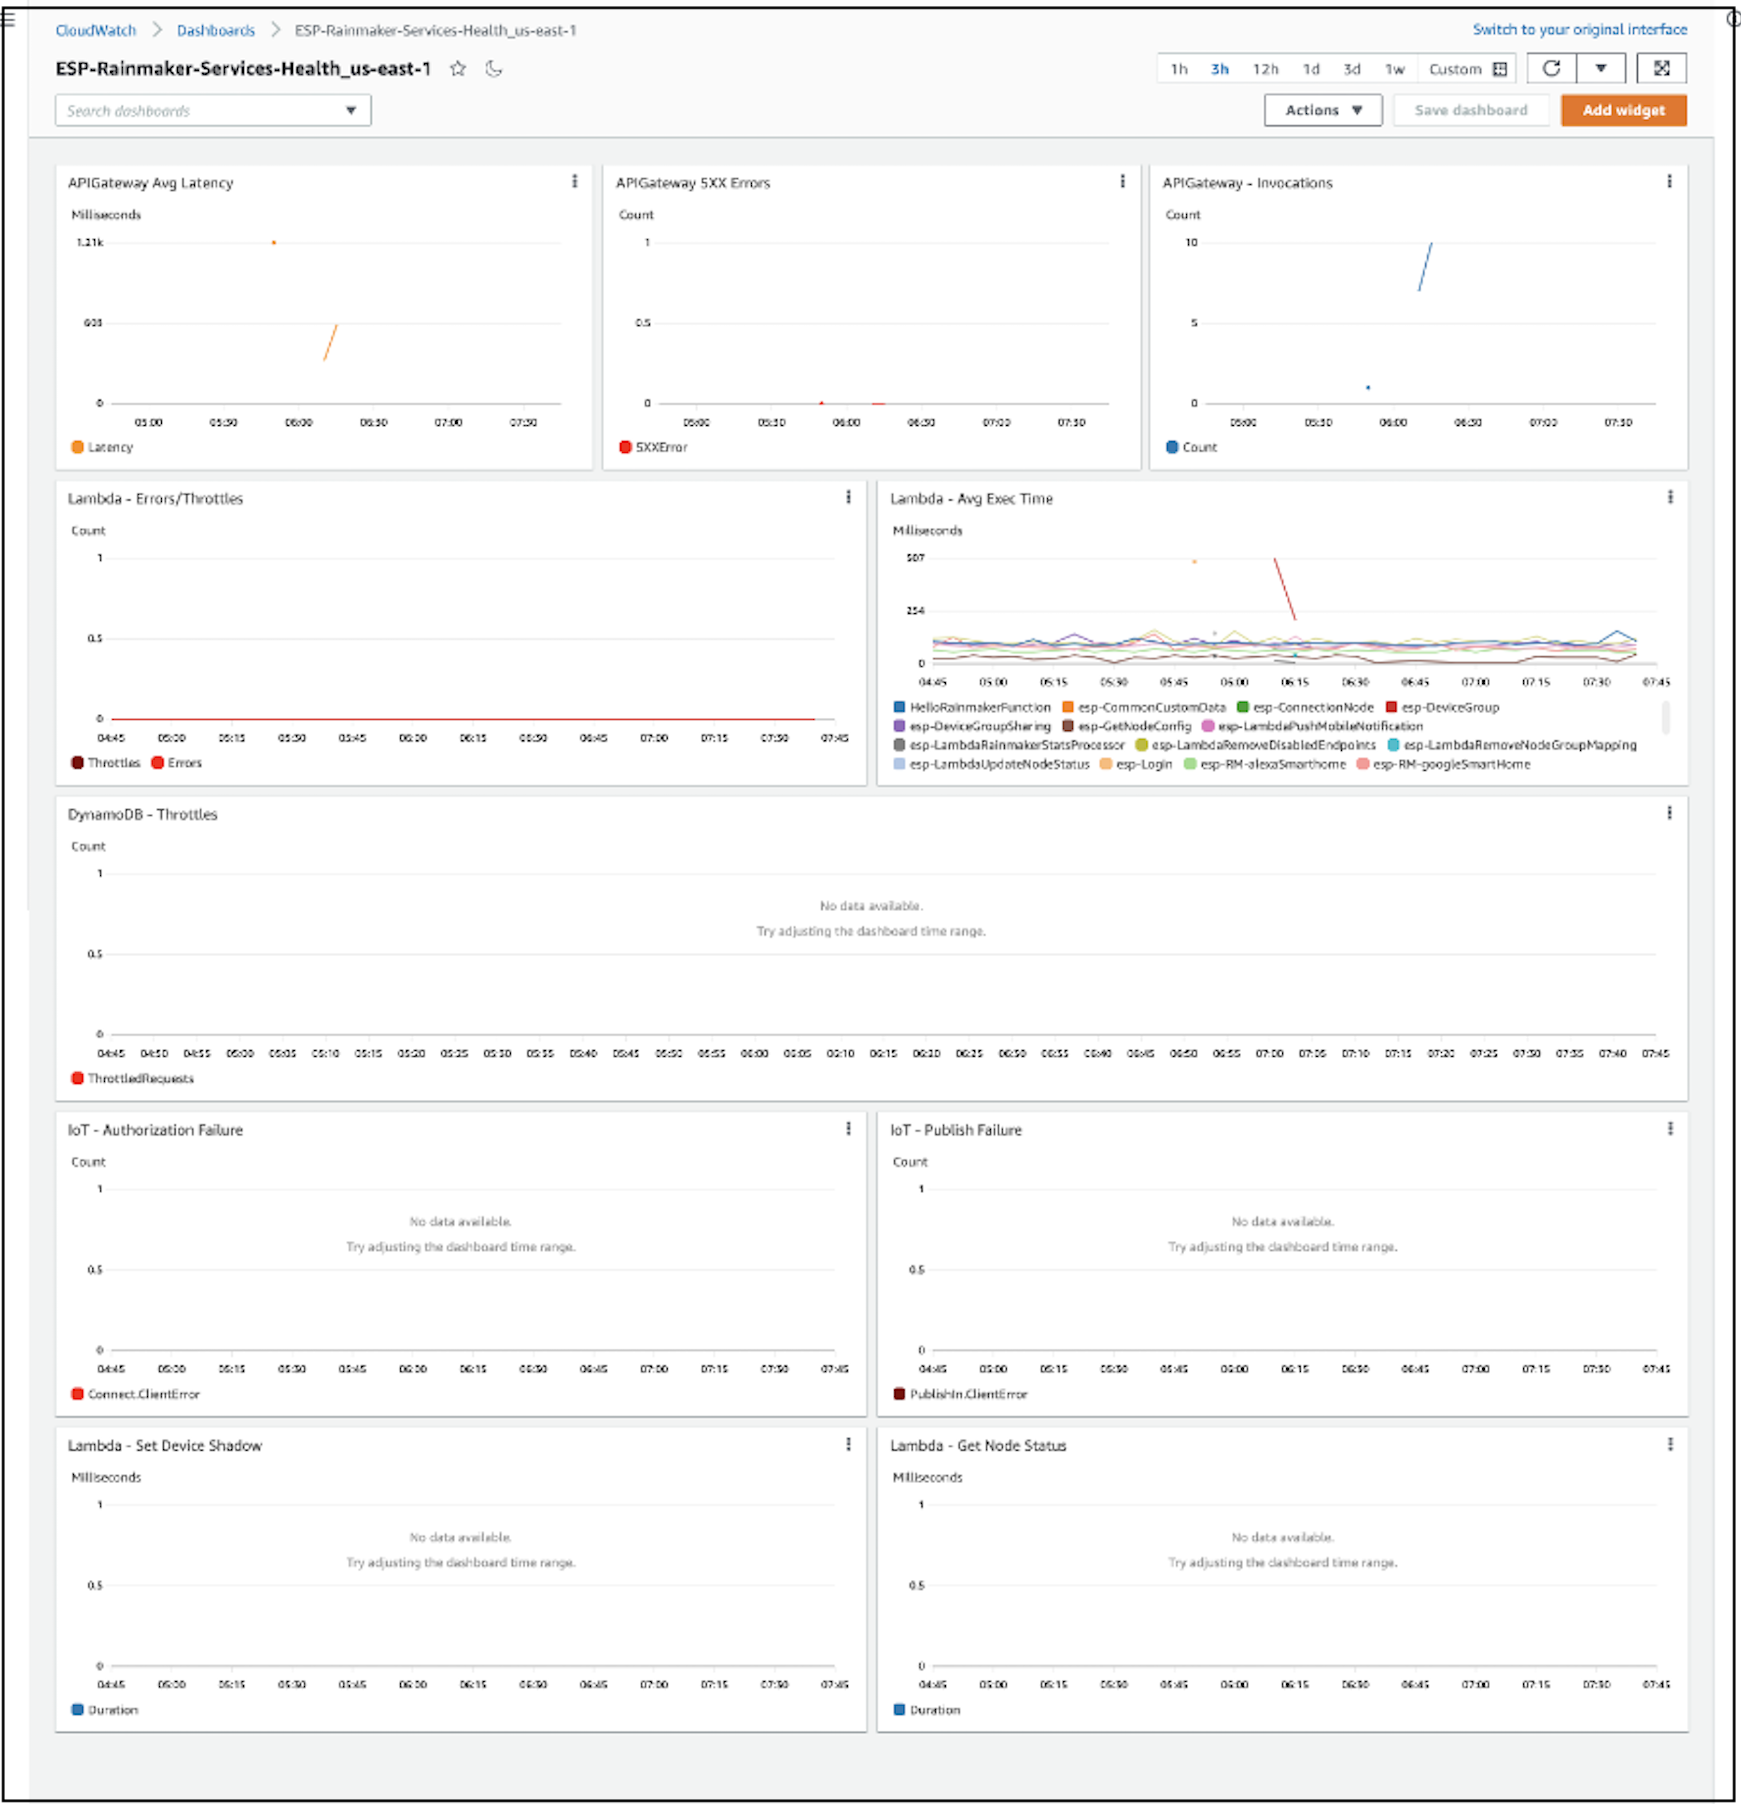
Rainmaker CloudWatch Dashboard is a monitoring tool for various Rainmaker AWS Service Metrics such as Lambda invocation/throttling count, API Gateway Call count, API Gateway error count, etc. It shows all these metrics at one place in AWS CloudWatch console -> Dashboards -> ESP-Rainmaker-Services-Health.

These metrics are provided by AWS. Rainmaker uses these metrics to create a visual representation of the same in one place. Each graph in the dashboard is called a widget. The aggregation type of each metric is specific to what needs to be shown on the graph.

The dashboard is shown in all regions of the AWS account, but the metrics that it shows are only for 1 region (for which the deployment was done). That region is also mentioned in the dashboard’s name.

The X and Y-axis are labeled about the information that they show.

Metrics

← FeaturesReferences →
Copyright © 2025 Espressif Systems